
Jubilee
Metals Group plc: Get ready for Lift-Off.

Counting down from six months to the end of H2 2024 (June 2024) for Jubilee
Metals Group (“JMG”). 6, 5, 4, 3, 2, 1 months and we will have lift-off. With
January and February 2024 already in the past, only 4 counts remain.
The new Jubilee Metals Group was born just over ten years ago when it
transitioned to essentially an innovative specialist metallurgical business
model. It targeted a huge greenfield gap in the smelting and beneficiation of
above ground mineral “ore” stocks in waste or discard materials. Most of these
materials were left-behind pollutants of legacy mines, materials considered
uneconomical to process.
"All overnight success
takes about 10 years."
Jeff Bezos At The
Economic Club Of Washington (9/13/18)
JMG developed the technologies to change that and turn rubbish to gold so to
speak, literally turning waste materials into valuable commodities. Alchemy at
its best. Over ten years in the making, now JMG is ready for that overnight
success. I am expecting it to happen in H2 2024.
JMG proved its technologies and its expertise in the processing of chrome
with Platinum Group Metals (“PGM”) as a byproduct. The essence of innovation is
not in the product but in the technology and a “good” technology will migrate
across similar products. JMG excelled in its chrome processing and then once
again identified a unique greenfield opportunity in Zambian copper waste and
discarded materials.
The ten-year path to overnight success started with the identification of a
unique metallurgical opportunity. The next phase was the strategic move into
copper. Chrome and PGM is now a reliable mature business. Copper is the new
horizon for JMG, and it’s moment has arrived.
Copper
The defining copper strategy event was the acquisition of the Sable Refinery
in August 2019 almost 5 years ago. Halfway towards its 10-year overnight
success. The rundown Sable refinery was repurposed and innovatively modernized.
It was also converted to a modular expansion plant, designed on the foundations
of the innovative technologies developed for the chrome business. The Sable
Refinery has since been supplemented with the, also modular, Roan
Concentrator. A unique and innovative processing plant purposely designed to
accept a wide range of copper bearing materials for processing to refinable
copper concentrates at a single facility. Feedstock from Roan is refined to
copper cathode at Sable as part of the strategy to reach 25,000 tonnes of
copper production made up of a combination (around 50/50) of copper concentrate
and copper cathode (Interim
Results Presentation, Slide 6, CFO comment).
The transition of innovative technologies was proven with copper. A
different commodity, a different country, but the true value locked away from
sight is the technological competence of JMG. Copper production was initiated,
the technologies tested and reshaped for copper. It is still being perfected
yet production of copper at around 1,500 tonnes in FY 2021 is targeted to reach
almost 6,000 tonnes in FY 2024. Reported progress is that copper production
capacity is expected to reach 25,000 tonnes already in FY 2025. Copper
production at those levels will not be far behind given the track record of
JMG.
Copper production for FY 2023 was just short of 3,000 tonnes. Doubling to
almost 6,000 tonnes in FY 2024 is guided (confirmed in the recent Interim
Results Presentation). Copper production, even at the lower pre-2024 levels, is
exceptionally profitable with gross profit margins around 40%! Copper
production at full capacity of 25,000 will be transformative for JMG and yet it
will still only be the completion of the first step in its copper journey.
Low-cost mineral production from discards is at the heart of JMG’s technology.
Combine that with production economies of scale for break-out company
profitability and that instant success ten years in the making is right here
starting in H2 2024. FY 2025 will be the defining annual “moment”, be ready for
it.
The next phase in the copper journey will be the implementation and
integration of the recently announced new copper initiatives in Zambia.
JMG announced a new Slag
Project with Mopani Copper Mines in October 2023 (now named the
Mufulira Slag Project). Mopani Copper Mines has since been acquired by Abu
Dhabi based International Resources Holding RSC Limited ("IRH"). The
Mufulira Slag project targets profitable processing of 13 million of historical
slag containing an estimated 0.7% copper and 0.27% cobalt as a testament to its
expertise and technological competence. The Mufulira Slag Project is estimated
to yield 89kt of copper and 44kt of cobalt. The context is that this single
project would supply the equivalent of more than 3 years of copper full
production at 25,000 tonnes pa as a still to be unlocked growth initiative.
JMG and IRH entered into an additional new JV development arrangement, the Waste
Rock Project. The fundamental deal is that JMG will provide the
technological processing expertise for the JV and IRH will provide the funding
and financial support, certainly a match made in business heaven. JMG surveyed
the available materials for processing to be 260 million tonnes on surface. No
digging or blasting for it. The materials are suitable for both concentrate
production and for refining copper cathode in this yet another unfolding growth
initiative.
The
Munkoyo Project ("Munkoyo") is located within 50
kilometers of Sable and will be another feedstock source for Sable. JMG has
tested and refined about 80,000 tonnes of mined ore from Munkoyo at copper
grades ranging from 1.5% to 3%. Munkoyo has significant near surface copper
ores and further exploration will illuminate the total extent of this
opportunity as a longer-term additional feedstock sustainability project. JMG
has an option to acquire the Munkoyo Project. The higher grades of the Munkoyo
project are like copper candy for JMG.
The mature chrome business is not static and is targeting production growth
to exceed the production of 2million
tonnes of chrome concentrate. That capacity target is expected to be
achieved by FY 2025. The main driver behind the chrome growth strategy is owned
production with the expansion of the Thutse
Project adding a further 50 000 tonnes per month feed
processing. That in turn allowed for the implementation of an additional
300,000 tonnes pa chrome concentrate production module targeted for Q3 2024
(reporting period FY June 2024 so Q3 is Jan -March 2024). The new module would
bring chrome concentrate production capacity to 1,75mil tonnes pa before FY
2024. More advances from Thutse can be expected.
JMG Interim Results 2024 (six-month period
ending December 2023)
The H1 Interim
Results have recently been released.
- "Group revenue increased by 18.4% to £74.7
million (H1 FY2023: £63.1 million) driven by increased production during
the period.
- Group earnings before interest, tax,
depreciation and amortisation (EBITDA) increased by 13.6% to £11.7 million
(H1 FY2023: £10.3 million).
- Group profit after tax increased by 7.3%
to £4.4 million (H1 FY2023: £4.1 million)
- Earnings per share increased by 6.7% to
0.16 pence per share (H1 FY2023: 0.15 pence per share)"
Full year production guidance for copper remains at 5,850 tonnes, similarly
PGM production guidance is held at 42,000 oz. Chrome production is expected to
exceed the 1.45 million tonnes guidance as was discussed above with the
addition of a further chrome production module in Q3 2024.
These results were achieved despite the PGM disastrous price collapse. The
PGM GBP revenue dropped by 26.8% from lower production, lower prices, and
higher costs. The PGM gross profit margin collapsed by 81.6% and yet the JMG
posted interim results were impressive with an 18.4% increase in Group Revenue,
13.6% increase in EBITDA and earnings per share growing by 6.7%. The main
driver behind the sterling results, almost fully mitigating the PGM disaster,
came from the chrome growth strategy, higher chrome prices, the Thutse chrome
owned production drive and the move from fixed external processing margins to
price variable gross profit margins. The chrome business result is that the
gross profit margin on higher chrome production increased by 240%.
The growth in copper production, combined with the excellent chrome results,
is expected to more than fully mitigate the PGM business unit decline.
Updating the JMG Scenario Model
The income statement model comes in two parts. The foundation is the
division into business units, chrome, PGM and copper. The details are then
consolidated into a JMG income statement.
The business units data have been updated from the information supplied by
the company in its Interim Financial Report for H1 2024 as well as from details
supplied in the Interim Results Investor Presentation (both already linked
above).

Source: Data from JMG, model built by Sarel Oberholster (click on the image for a larger view)
The most important developments have been:
- The solid growth in chrome production supported by a robust
chrome price increase achieved.
- The implementation of another 300,000 tonnes pa chrome
production capacity module with expected chrome production capacity
reaching 2million tonnes by FY 2025 (June 2025).
- The accelerated expansion in copper production with an
expectation that copper production capacity will breach 25,000 tonnes in
FY 2025.
The severity of the PGM decline is probably unsustainable as the industry
simply cannot maintain market supply at these depressed price levels. I expect
the PGM prices to rather advance from here which could add to better results
for JMG, but JMG results are about to pop even if the PGM prices remain at
these levels.
The production advances in chrome, but by far the most important, the
production advances in copper will catapult JMG revenue to a new level. I have
highlighted in dark blue the FY 2025 expected production advances. The
viability of the copper strategy comes into sharp focus when we look at the
copper revenue jumping from around £17mil in FY 2023 to around £31.5 expected
in FY 2024, then moonshot to an expected £132mil in FY 2025 on the back of
production growth. The chrome growth strategy is not as spectacular but still
incredible with chrome revenue advancing from £80.6mil in FY 2023 to an
expected £109mil in FY 2024 to reach an expected £142mil in FY 2025.
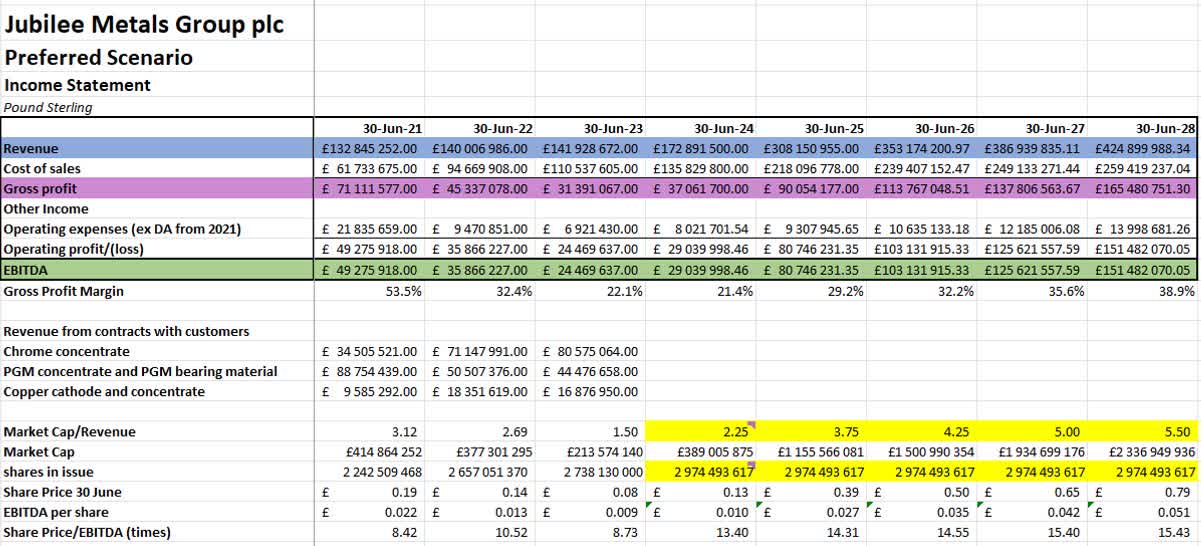
The effect on JMG consolidated results is equally moonshot spectacular.

Source: Data from JMG, model built by Sarel Oberholster (click on the image for a larger view)
Group revenue is expected to top £308mil by FY 2025 from a reported £142mil
FY 2023 with the jump to £173mil for FY2024 almost as “nice”. FY 2024 is the
potatoes; the meat arrives in FY 2025 with EBITDA jumping from less than £25mil
in FY 2023 to almost £81mil expected in FY 2025.
Investors in JMG will have their full plate of meat and potatoes by FY 2025.
Its all under the radar presently. The share price remains mired in the
doldrums. JMG gives the information to the market, yet it seems nobody
believes. Then the market wakes up on one unpredictable trading day and over a
few trading days advance the share price by 200% or 300%. The share price
target for FY 2025 for JMG is 39 pence from the current share price drifting
around 5 pence. I’ve seen this slumber and explode share price moves happen
often enough. Will you be there when it happens, or will you try and catch the
rocket as it makes its moonshot, or will you remain unconvinced and tell the
story of how you almost caught that big one? As disclosed, I have a ticket.
Sarel Oberholster
4 March 2024


![[Most Recent Quotes from www.kitco.com]](https://lh3.googleusercontent.com/blogger_img_proxy/AEn0k_tgx8ZtaE0WtmyD-G11ocDFHQ1Hfgn4ZG5jI8TrfUVWgMAa0Bgnct0gdrXZJpm1pGZu4QMDGCHLCfajXcjo7ww8Vu_uGkJOpbFFMGgEeBi9wPx_y8yTh_filBsbP_UABiYztQ=s0-d)
![[Most Recent Charts from www.kitco.com]](https://lh3.googleusercontent.com/blogger_img_proxy/AEn0k_vXxOBwHhSIH7s37Aq0t0Cr4oLgNYG9hDQe_4wj7XObdjChcb_Ux4vrs-n3pdy5k9txIY2a3aStJITwvGWedWouQrUl_F5MphLoOX2J1E2pqso5MMmvqtpLM5wN5hCmwHGu4J7FHC4=s0-d)
![[Most Recent Quotes from www.kitco.com]](https://lh3.googleusercontent.com/blogger_img_proxy/AEn0k_vGSObE5yg3L0J_ODtTKfkNP5Vz_SaWJmxuzEs2CP5wBeh3cr5TlId1Fin9cFP7l_PNWeKT-gVUTDTlKmmSlyELSWJUrbDiK_ppDh7QvFXk9RoYCrNyGGVyZsPHCs7Hrw=s0-d)

